CircuitPython Histogram Library
uhistogram
CircuitPython library to calculate and graph histograms
Author(s): Jose D. Montoya
Implementation Notes
Depends on CircuitPyton version 8.0.0
- class uhistogram.Histogram(*args: Any, **kwargs: Any)
A Histogram TileGrid. The origin is set using
xandy.- Parameters:
data ((list, tuple)) – source data to calculate the histogram
x (int) – x position of the histogram origin
y (int) – y position of the histogram origin
width (int) – requested width, in pixels. Defaults to 100 pixels.
height (int) – requested height, in pixels. Defaults to 100 pixels.
line_color (int) – background color to use defaults to white (0xFFFFFF)
Quickstart: Importing and using uhistogram
Here is one way of importing the
uhistogram.Histogramclass so you can use it as the nameuhistogram.Histogram:from uhistogram import Histogram import displayio
Now you can create a boxplot at pixel position x=50, y=50 using:
a=[1, 1, 4, 5, 6, 7, 7, 7, 8, 9, 10, 15, 16, 17, 24, 56, 76, 87, 87]
my_histogram=Histogram(a, x=50, y=50) # instance the histogram at x=50, y=50
my_group = displayio.Group()
Once you set up your display, you can now add
my_boxplotto your display.Group() using:my_group.append(my_histogram) display.show(my_group) # add the group to the display
Summary: Histogram Features and input variables
The
uhistogramTileGrid has some options for controlling its position, visible appearance, through a collection of input variables:position:
x,ysize:
widthandheightcolor:
line_color
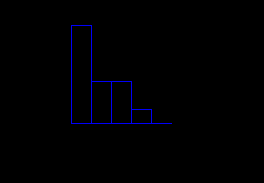
This is a diagram of a histogram
- draw()
This function draws the histogram
- static get_numberbins(data, rule=0)
Function that calculate the number of bins for the sample. you could use two rules, changing the parameter rule. rule = 0 applies Sturge’s rule rule = 1 applies square root choice rule = 2 will choose the best criteria to be applied. for data size < 30 –> Square Root Choice for data size > 30 –> Sturg’s Rule
- Parameters:
data – data to be analyzed
rule – desired rule. Defaults to 0.
- Returns:
bin calculated data
- static normalize(oldrangemin, oldrangemax, newrangemin, newrangemax, value)
This function converts the original value into a new defined value in the new range
- Parameters:
oldrangemin – minimum of the original range
oldrangemax – maximum of the original range
newrangemin – minimum of the new range
newrangemax – maximum of the new range
value – value to be converted
- Returns:
converted value
- print_data()
This function prints the bins data
- Returns:
None